Two recorded routes. One clear comparison.
| Route | AF/year |
|---|---|
| Homestake Tunnel export | 23,370.94 |
| Passing Gold Park | 21,498.22 |
MEASURED DATA + SAVE HOMESTAKE CALCULATION
Over WY2007-2024, 420,676.93 AF crossed the divide through Homestake Tunnel and 386,968.01 AF passed Gold Park. Annual means are 23,370.94 AF/year and 21,498.22 AF/year, respectively.
Across those two routes together, the tunnel share is 52.09% and the Gold Park share is 47.91%.
100 × 420,676.9294 / (420,676.9294 + 386,968.0066) = 52.0869%. The ratio uses summed volumes over 18 water years. Gold Park’s drainage is 35.6 square miles.
This captures the scale of recorded exports relative to measured creek flow below the existing collection system. A complete natural-runoff percentage additionally requires physical losses, external inflows and other basin corrections.
Source: HWA:S-GP-ANNUAL, matched annual DWR/USGS records; open annual inputs. The Gold Park daily series covers 6,575 days, including 2,876 estimated daily values. Source approval status and arithmetic precision do not remove measurement uncertainty.
The collection system above Gold Park
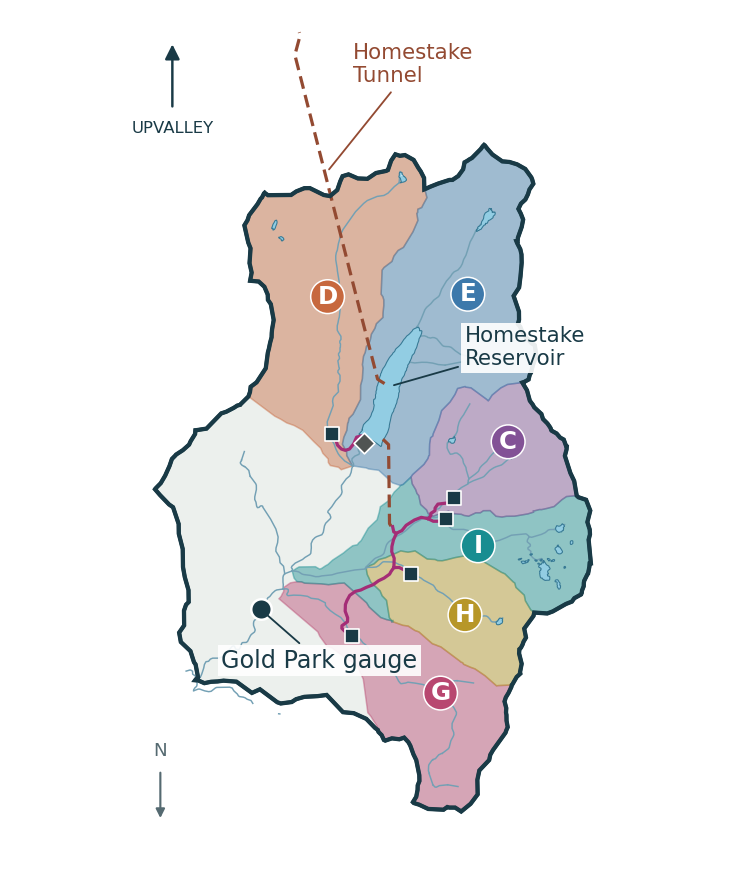
Map key: C Sopris; D East Fork; E Upper Homestake/native reservoir branch; G French; H Fancy; I Missouri remainder. Source geometry is preserved, upvalley at top. All five collector sites and Homestake Reservoir pass the recovered map’s Gold Park containment check. Colored polygons represent the modeled source areas identified in the map methods. The Gold Park gauge is downstream of French Creek.
Collection, export and timing
AGENCY DATA + SAVE HOMESTAKE CALCULATION
Existing intake | Average recorded capture, AF/year | Period |
|---|---|---|
French Creek | 3,530.90 | WY2014-2024 |
Fancy Creek | 1,779.67 | WY2014-2024 |
Missouri Creek | 1,742.73 | WY2014-2024 |
Sopris Creek | 2,485.52 | WY2014-2024 |
East Fork Homestake Creek | 3,610.13 | WY2014-2024 |
Five collectors combined | 13,148.95 | 11 water years |
These are recorded intake captures. The water subsequently passes through reservoir and tunnel accounting, so collector capture must never be added to tunnel exports as another withdrawal. 88.26% of the recorded five-collector capture occurred in May-June and 99.30% in May-July. That seasonal concentration makes timing central to the ecological evaluation. WATER:TECH-02
The partial-balance calculation
Adding +1,011.4987 AF of endpoint storage and 4,321.7130 AF of recorded evaporation accounts yields 812,978.1477 AF over 18 years, or 45,165.4527 AF/year. Export divided by this partial denominator is 51.7452%.
This remains a partial accounting result. The next step is to bound incremental physical losses, external replacement inflows, other net depletions and measurement corrections at this basin boundary.
Keep the downstream comparisons separate
Red Cliff’s historical two-path share is 43.0448% during WY2007-2011, within a 58.2-square-mile drainage. Gold Park and Red Cliff are different basin-period comparisons. Neither is a current full-mouth percentage.
Full methods, collector tables, basin status, rights-versus-flow distinctions, source accounts, unresolved outlet channels and replication commands are preserved in the Water Technical Companion.